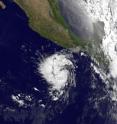
A double-satellite NASA-style view of the first tropical storm in eastern Pacific: Adrian
The first tropical depression in the Eastern Pacific Ocean is now the first tropical storm, and two satellites are providing NASA insights into its thunderstorms, rainfall, and intensity. NASA satellite data on newly born Tropical Storm Adrian shows high cloud tops and moderate rainfall, indications that the storm is getting stronger, triggering a tropical storm watch in Mexico. Tropical Depression 1E is the first tropical depression of 2011 and formed in the eastern Pacific Ocean early on June 7. By the morning of June 8 it had strengthened into Tropical Storm Adrian, and is now forecast by the National Hurricane Center to reach hurricane strength. This morning, the government of Mexico posted a tropical storm watch for the Mexican coast from Acapulco, west to Punta San Telmo. That means conditions are possible in the watch area from 24 to 48 hours. Meanwhile, rough surf and rip currents can be expected in the southwestern Mexican coast later today.
When the Geostationary Operational Environmental Satellite called GOES-11 passed over Tropical Storm Adrian earlier today, June 8 at 12:00 UTC (8:00 a.m. EDT), an infrared image shows Adrian as a compact, rounded storm off the western Mexico coast. GOES satellites are managed by NOAA, and images and animations are created at NASA's Goddard Space Flight Center in Greenbelt, Md. by the NASA/NOAA GOES Project.
The GOES-11 image revealed that Adrian has some higher, stronger thunderstorms around the center of circulation that are casting shadows on lower clouds around them. Those higher thunderstorms are stronger than the surrounding thunderstorms, and are likely dropping heavy rainfall (as much as 2 inches/50 mm per hour). The higher thunderstorms are also a sign that the storm continues to strengthen.
Rainfall within Adrian was captured yesterday, June 7 at 0727 UTC (3:27 a.m. EDT), when it was still Tropical Depression 1E. That's when the Tropical Rainfall Measuring Mission (TRMM) satellite flew overhead. TRMM is like a flying rain gauge in space because its precipitation radar instrument can measure rainfall rates. At that time TRMM noticed that Tropical Depression 1E had moderate rainfall surrounding its low level center. Moderate rainfall rates are between .78 to 1.57 inches (20 to 40 mm) per hour.
Adrian was already close to hurricane strength this morning, June 8. At 8 a.m. PDT (11 a.m. EDT), Adrian's maximum sustained winds were near 70 mph (110 kmh. It was about 285 miles (455 km) south-southwest of Acapulco, Mexico near 12.9 North and 100.8 West, and moving north-northwest near 5 mph (7 kmh). Minimum central pressure was 994 millibars.
The National Hurricane Center forecasts that Adrian will continue to strengthen and turn to the north-northwest, followed by a turn to the west-northwest.
Source: NASA/Goddard Space Flight Center
Articles on the same topic
- NASA sees heavy rainfall in Tropical Storm SarikaFri, 10 Jun 2011, 19:35:45 UTC
- NASA catches system 92W become fifth NW Pacific tropical depressionThu, 9 Jun 2011, 20:37:02 UTC
- NASA's infrared image of major Hurricane Adrian reveals its stormy life's bloodThu, 9 Jun 2011, 20:36:48 UTC
- NASA sees a hot tower in first tropical depression of the eastern PacificTue, 7 Jun 2011, 21:02:49 UTC
- Possible first eastern Pacific tropical depression shaping up on NASA imageryTue, 7 Jun 2011, 18:35:52 UTC
Other sources
- NASA sees heavy rainfall in Tropical Storm Sarikafrom PhysorgFri, 10 Jun 2011, 19:00:28 UTC
- NASA's infrared image of major Hurricane Adrian reveals its stormy life's bloodfrom PhysorgThu, 9 Jun 2011, 21:00:46 UTC
- NASA catches system 92W become fifth NW Pacific tropical depressionfrom PhysorgThu, 9 Jun 2011, 20:31:14 UTC
- A double-satellite NASA-style view of the first tropical storm in eastern Pacific: Adrianfrom PhysorgWed, 8 Jun 2011, 22:00:25 UTC
- Season's first tropical depression formsfrom UPIWed, 8 Jun 2011, 3:30:35 UTC
- Season's first tropical depression formsfrom UPIWed, 8 Jun 2011, 0:00:20 UTC
- NASA sees a hot tower in first tropical depression of the eastern Pacificfrom PhysorgTue, 7 Jun 2011, 21:30:55 UTC
- First Hurricane Of Season Forms In Pacificfrom CBSNews - ScienceTue, 7 Jun 2011, 20:31:29 UTC
- Satellite spots potential Pacific stormfrom UPITue, 7 Jun 2011, 18:30:31 UTC
- Satellite spots potential Pacific stormfrom UPIMon, 6 Jun 2011, 22:00:12 UTC
- Possible first eastern Pacific tropical depression shaping up on NASA imageryfrom PhysorgMon, 6 Jun 2011, 21:30:35 UTC
